Scroll down
Inequality in New York City
A Legacy of Redlining
Final Project for CS171 - Visual Eyes

WHAT EXACTLY IS REDLINING?


In the United States, Redlining, which began in the 1930s, refers to the racially discriminatory practice of denying home loans to borrowers in communities of color and poor communities based on perceived financial risk.


HOW WAS REDLINING DONE?


Neighborhoods that were deemed “hazardous” by the Home Owners’ Loan Corporation (HOLC), an official governmental body, were shaded in red on maps, and banks were encouraged to avoid lending in those areas.


BUT REDLINING HAPPENED A LONG TIME AGO... RIGHT?

  • 1930s

    Redlining began in the 1930s when the Federal Housing Administration (FHA) was created to insure mortgages. If a neighborhood was deemed too hazardous, banks didn't lend there. The FHA relied on maps drawn by the Home Owners’ Loan Corporation (HOLC), a governmental body. Through this official legal practice, the government enforced racial discrimination in housing.

  • 1951

    HOLC ceased operations in 1951, yet redlining was still legal and used to deny African Americans the right to own housing.

  • 1968

    The Fair Housing Act—a law finally prohibiting discrimination concerning the sale, rental and financing of housing based on race, religion, national origin, and sex was established.

  • Now?

    Although redlining is no longer enforced by the government, many New York City neighborhoods that were affected still experience economic hardship.

    In this story, we will explore the legacy of redlining in New York City.


“Excellent prospects” for investment—predominantly white neighborhoods—were green; other desirable areas were blue; “declining” areas were yellow; and predominantly Black communities were red. Properties in these “redlined” neighborhoods were deemed unsafe investments and were typically ineligible for federally-backed mortgages.

- Equal Justice Initiative


Redlining destroyed the possibility of investment wherever black people lived.

- The Case for Reparations by Ta-Nehisi Coates, The Atlantic

Although New York City has a reputation as a liberal city, it has its own legacy of redlining.

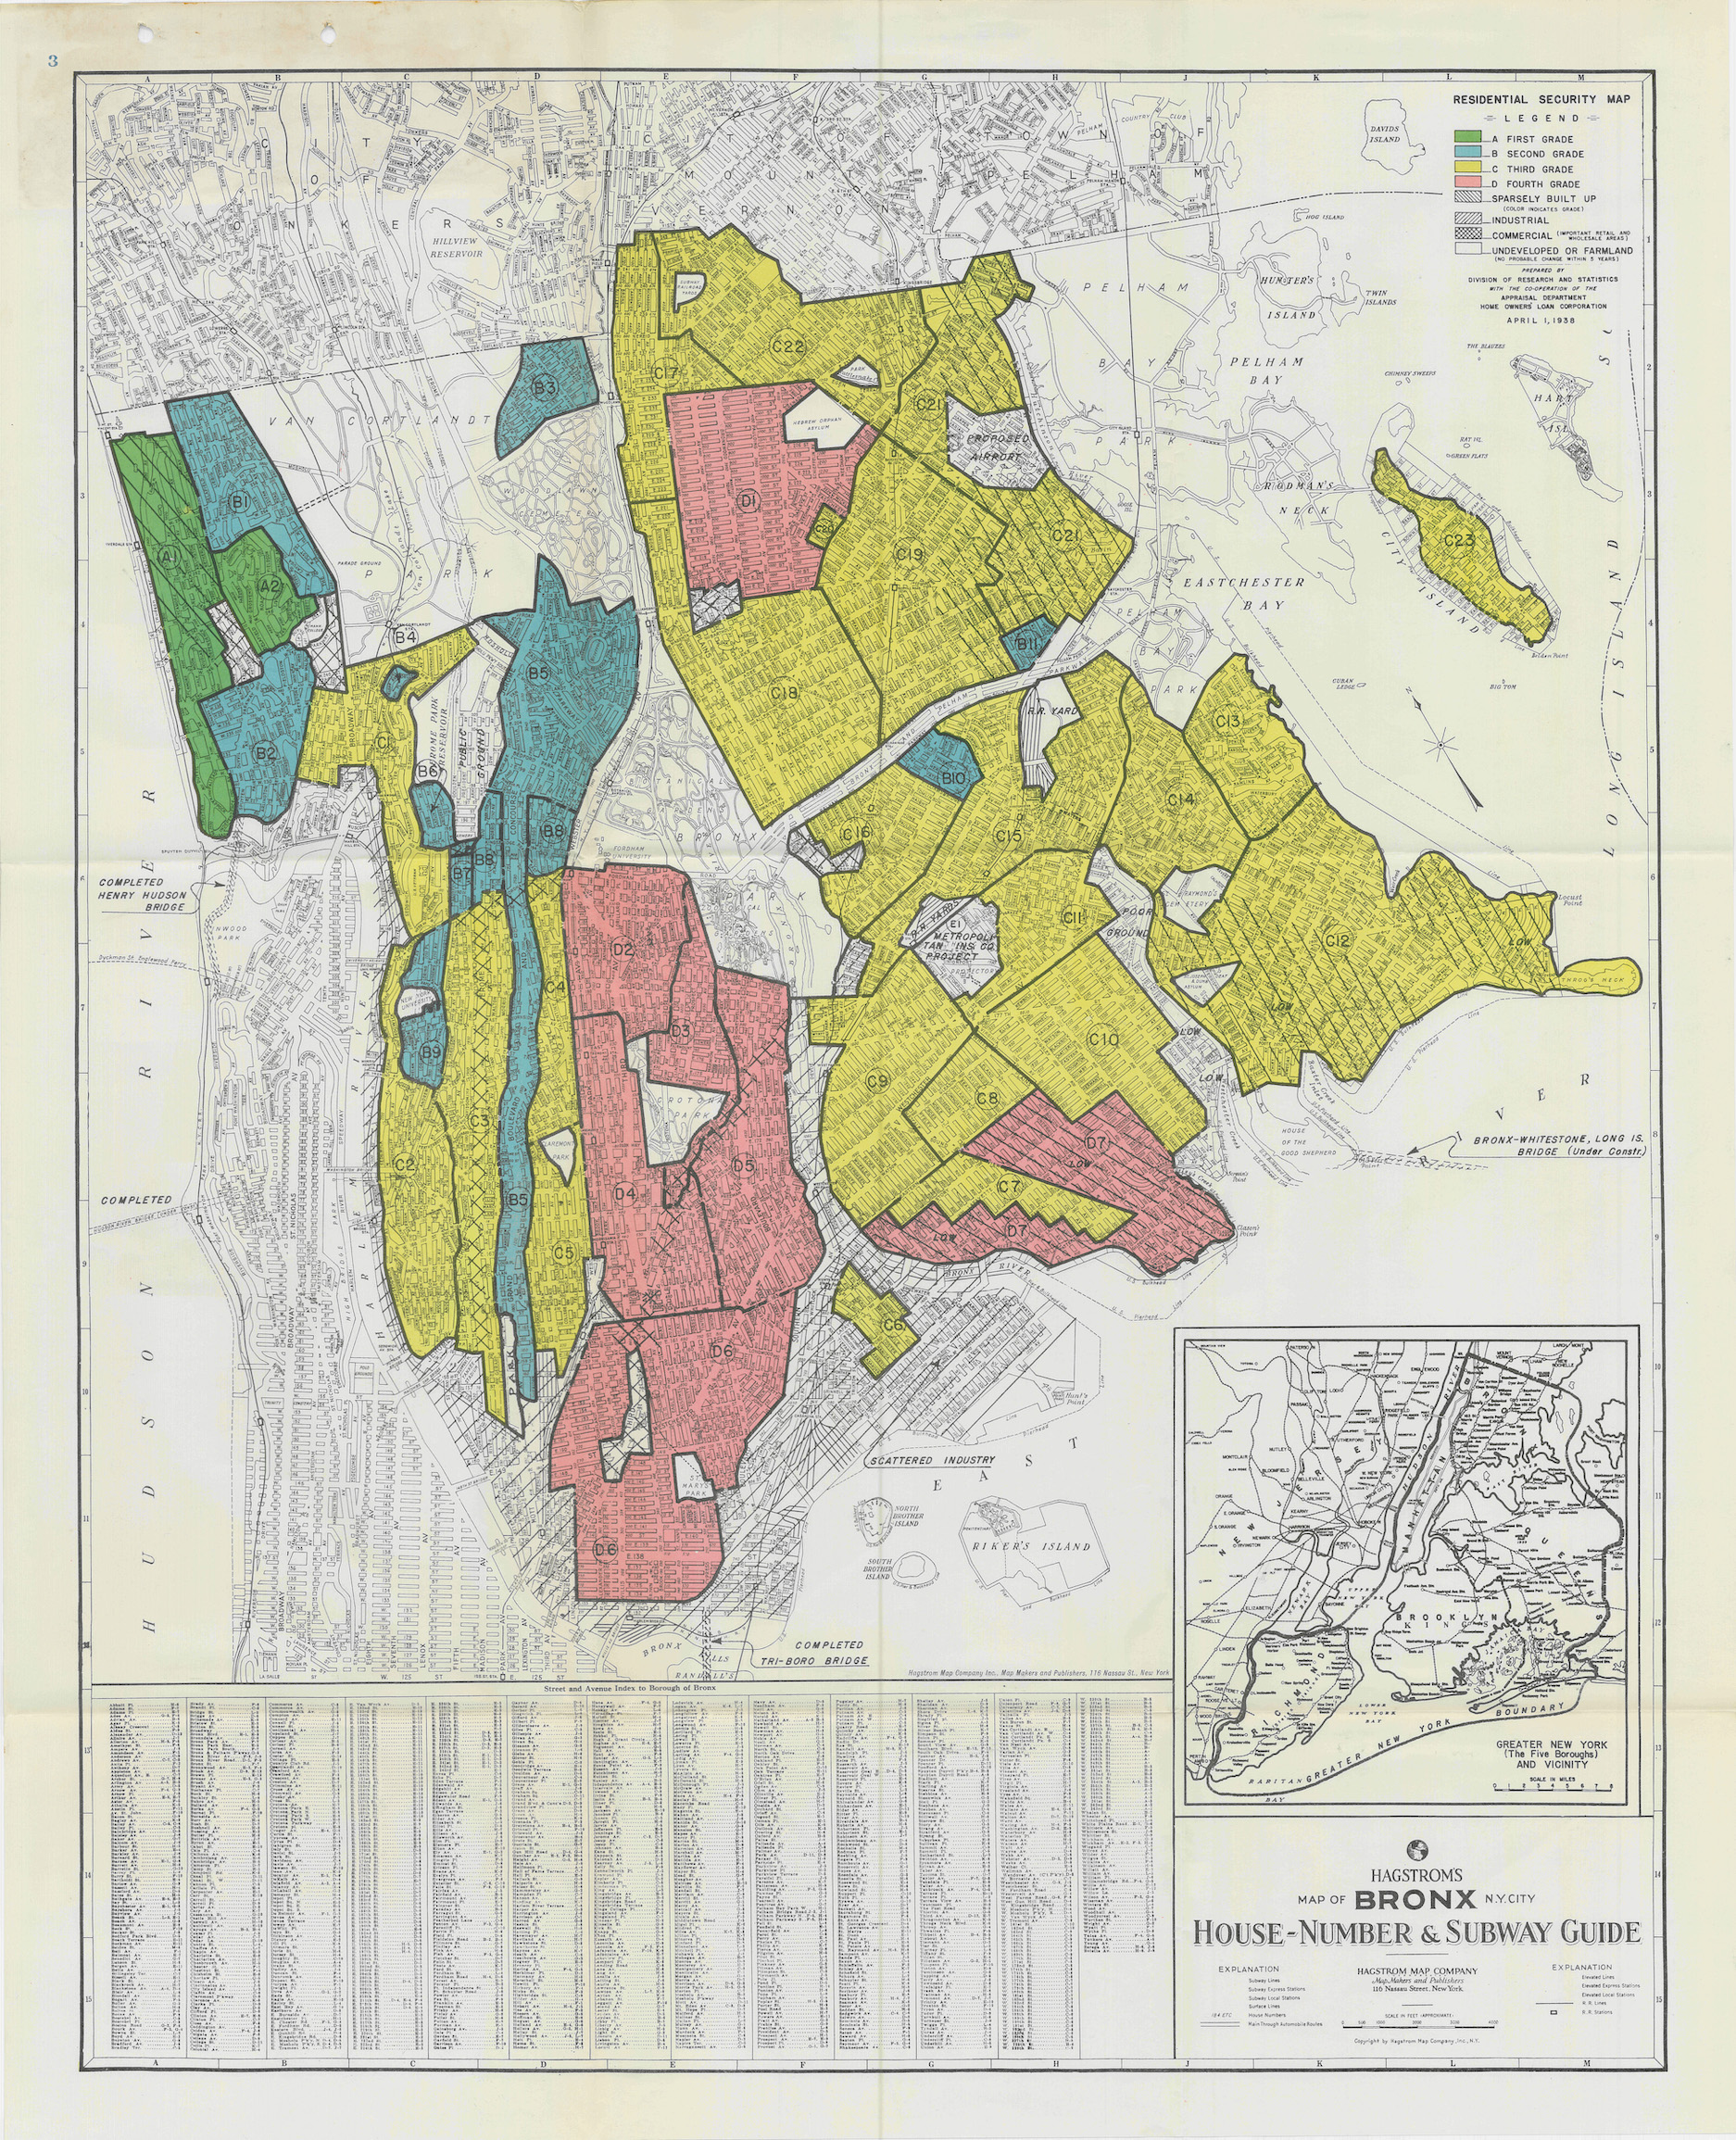
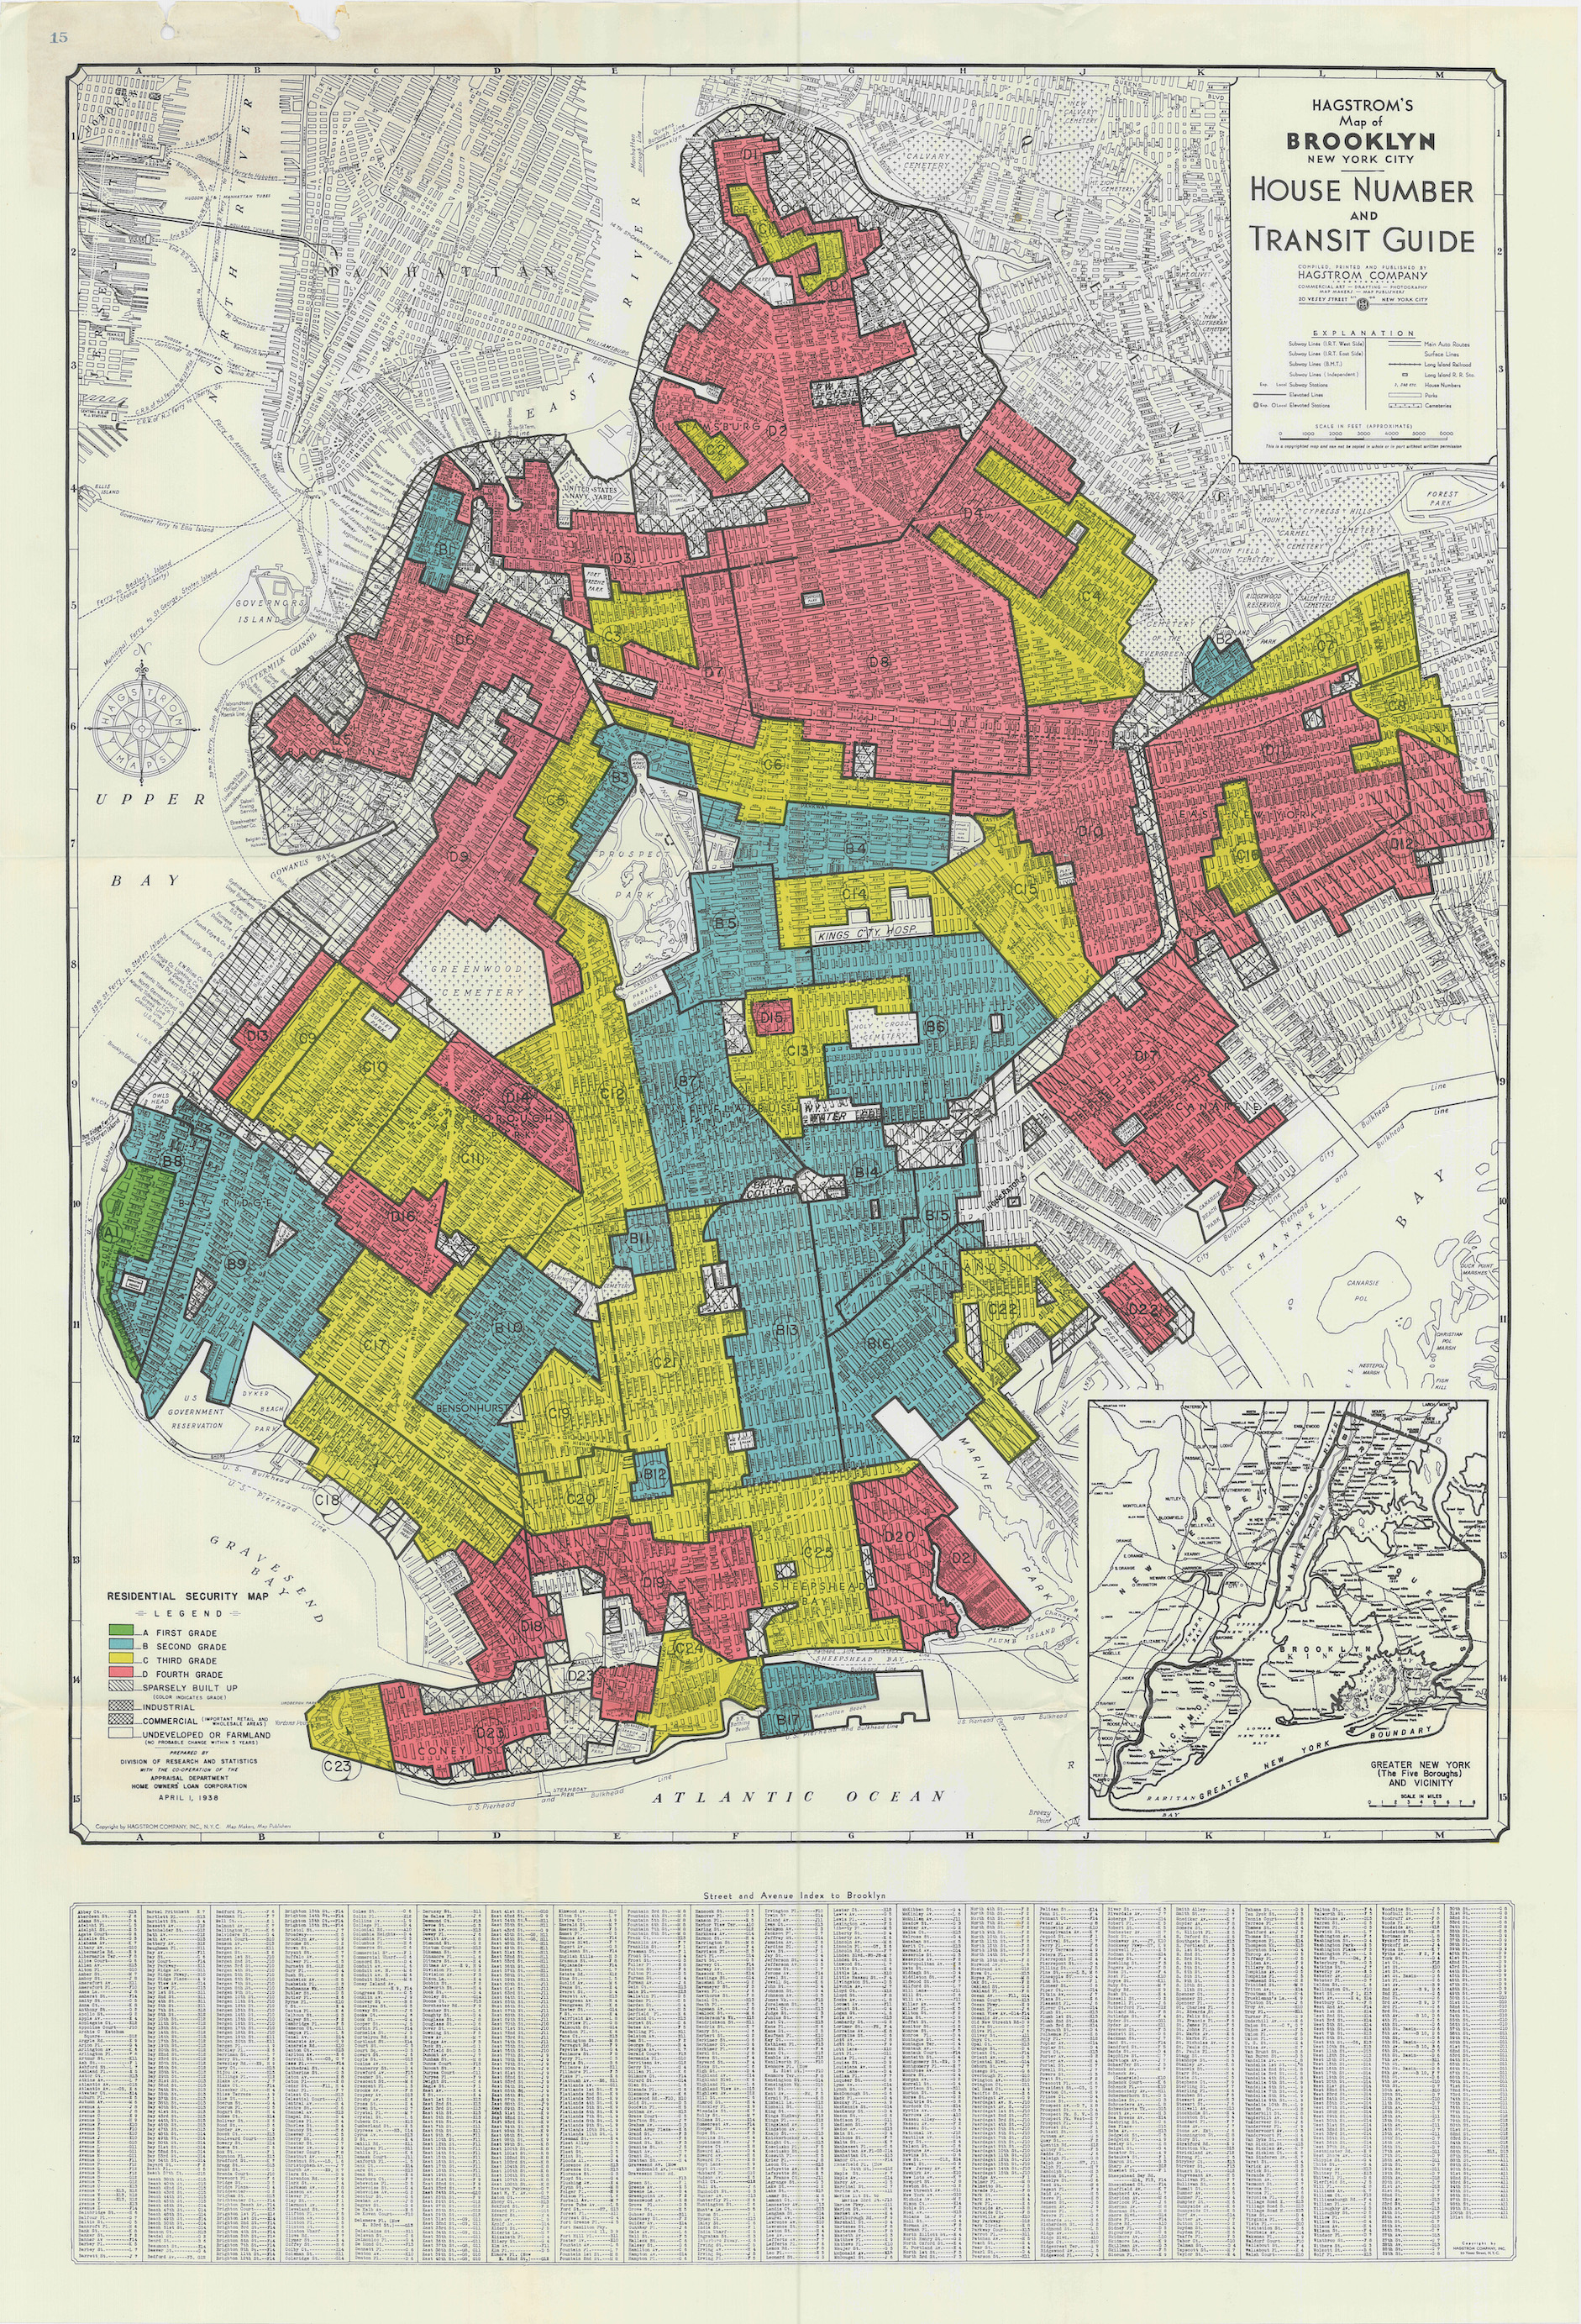
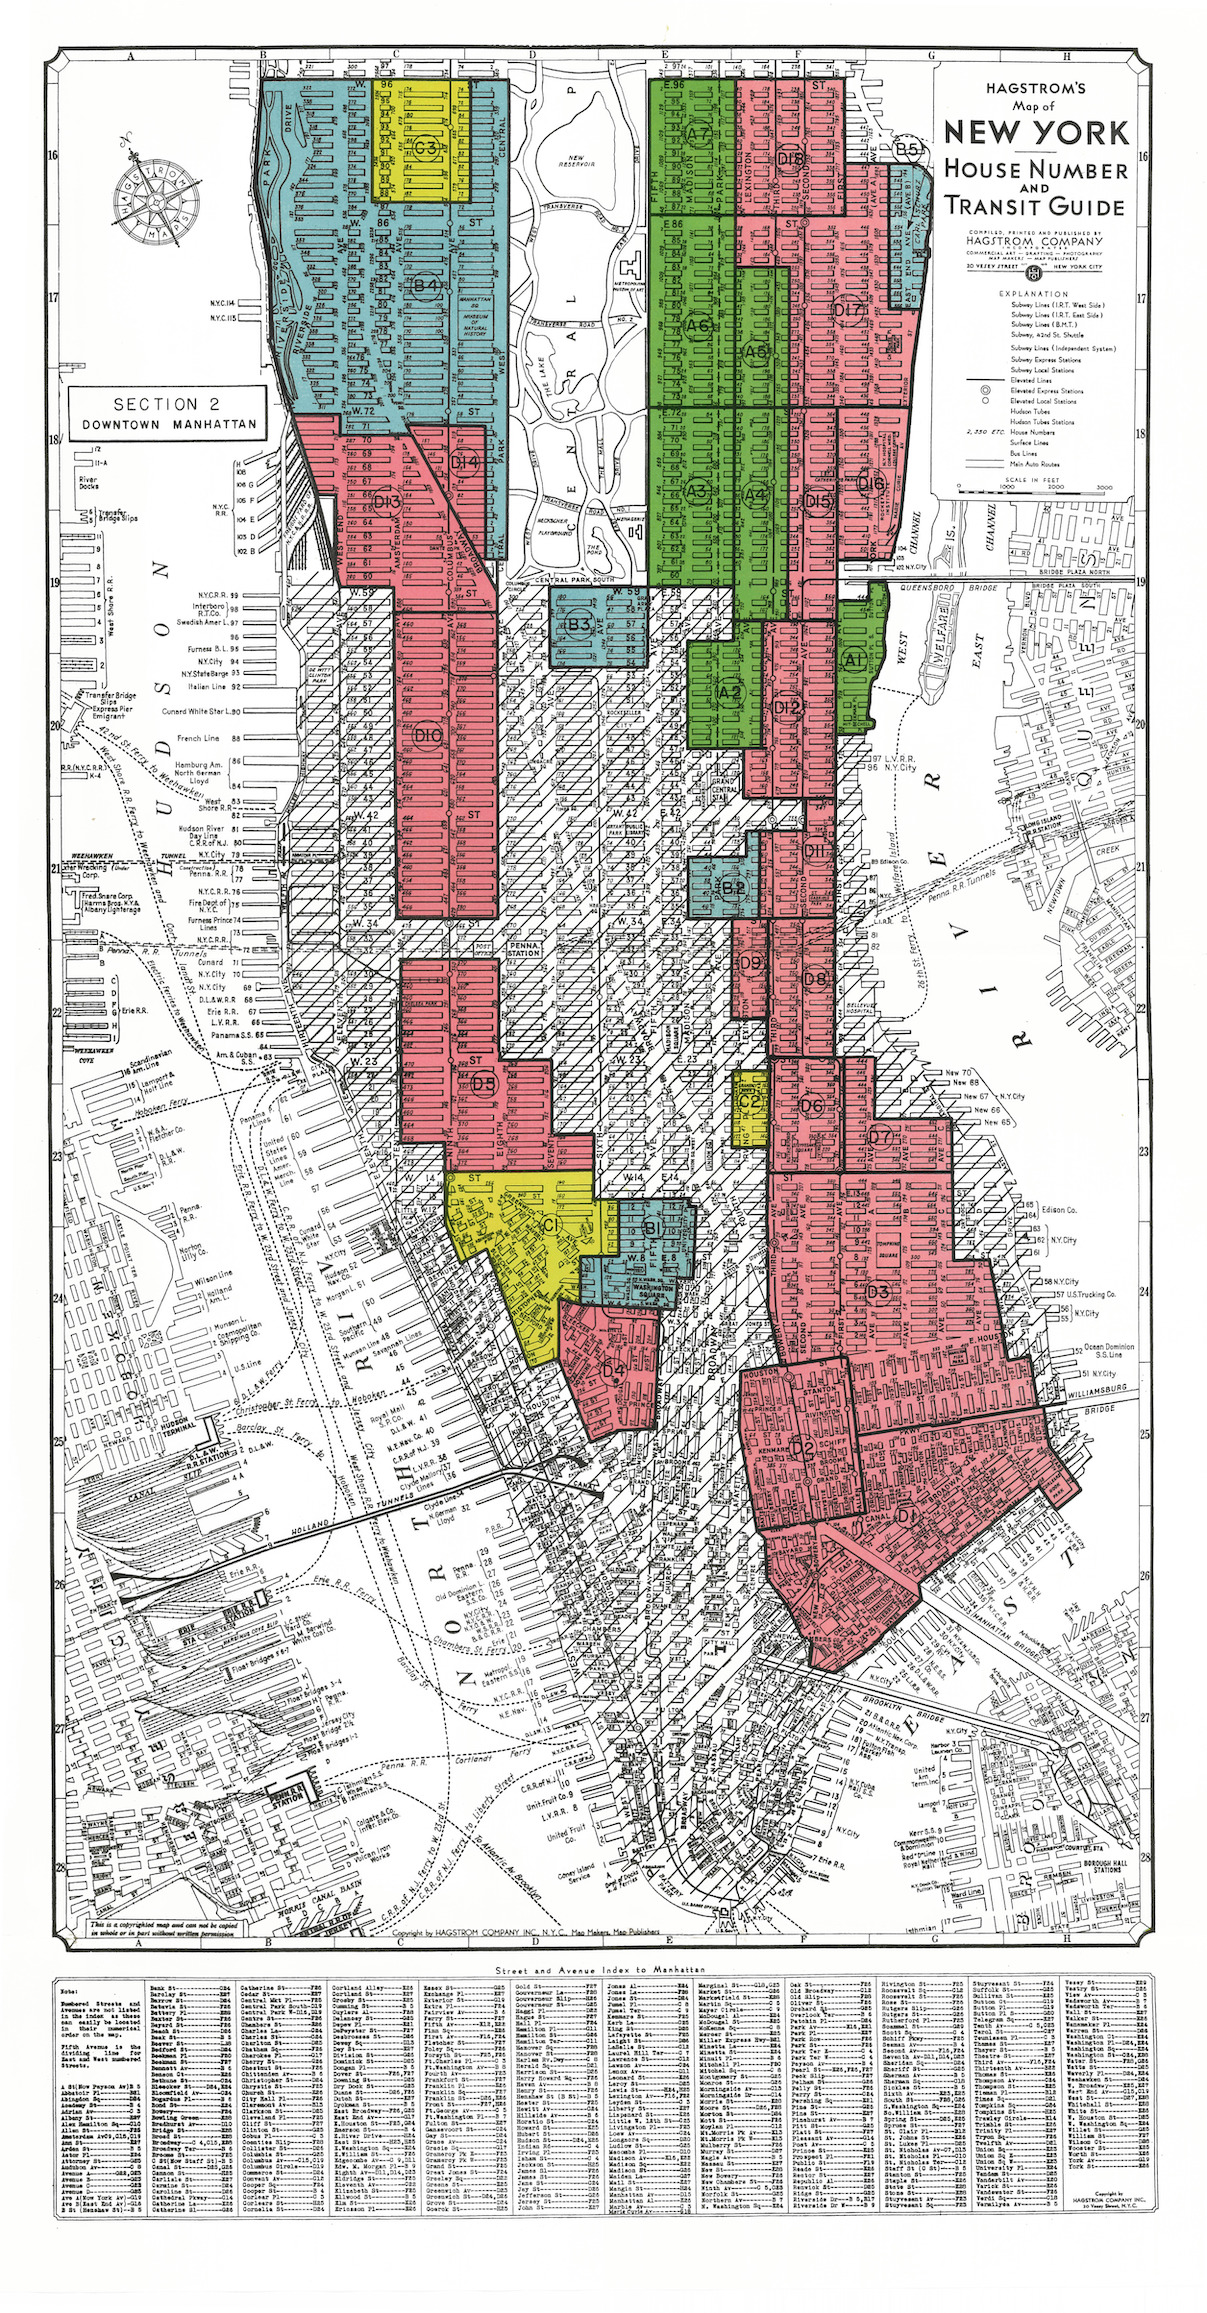
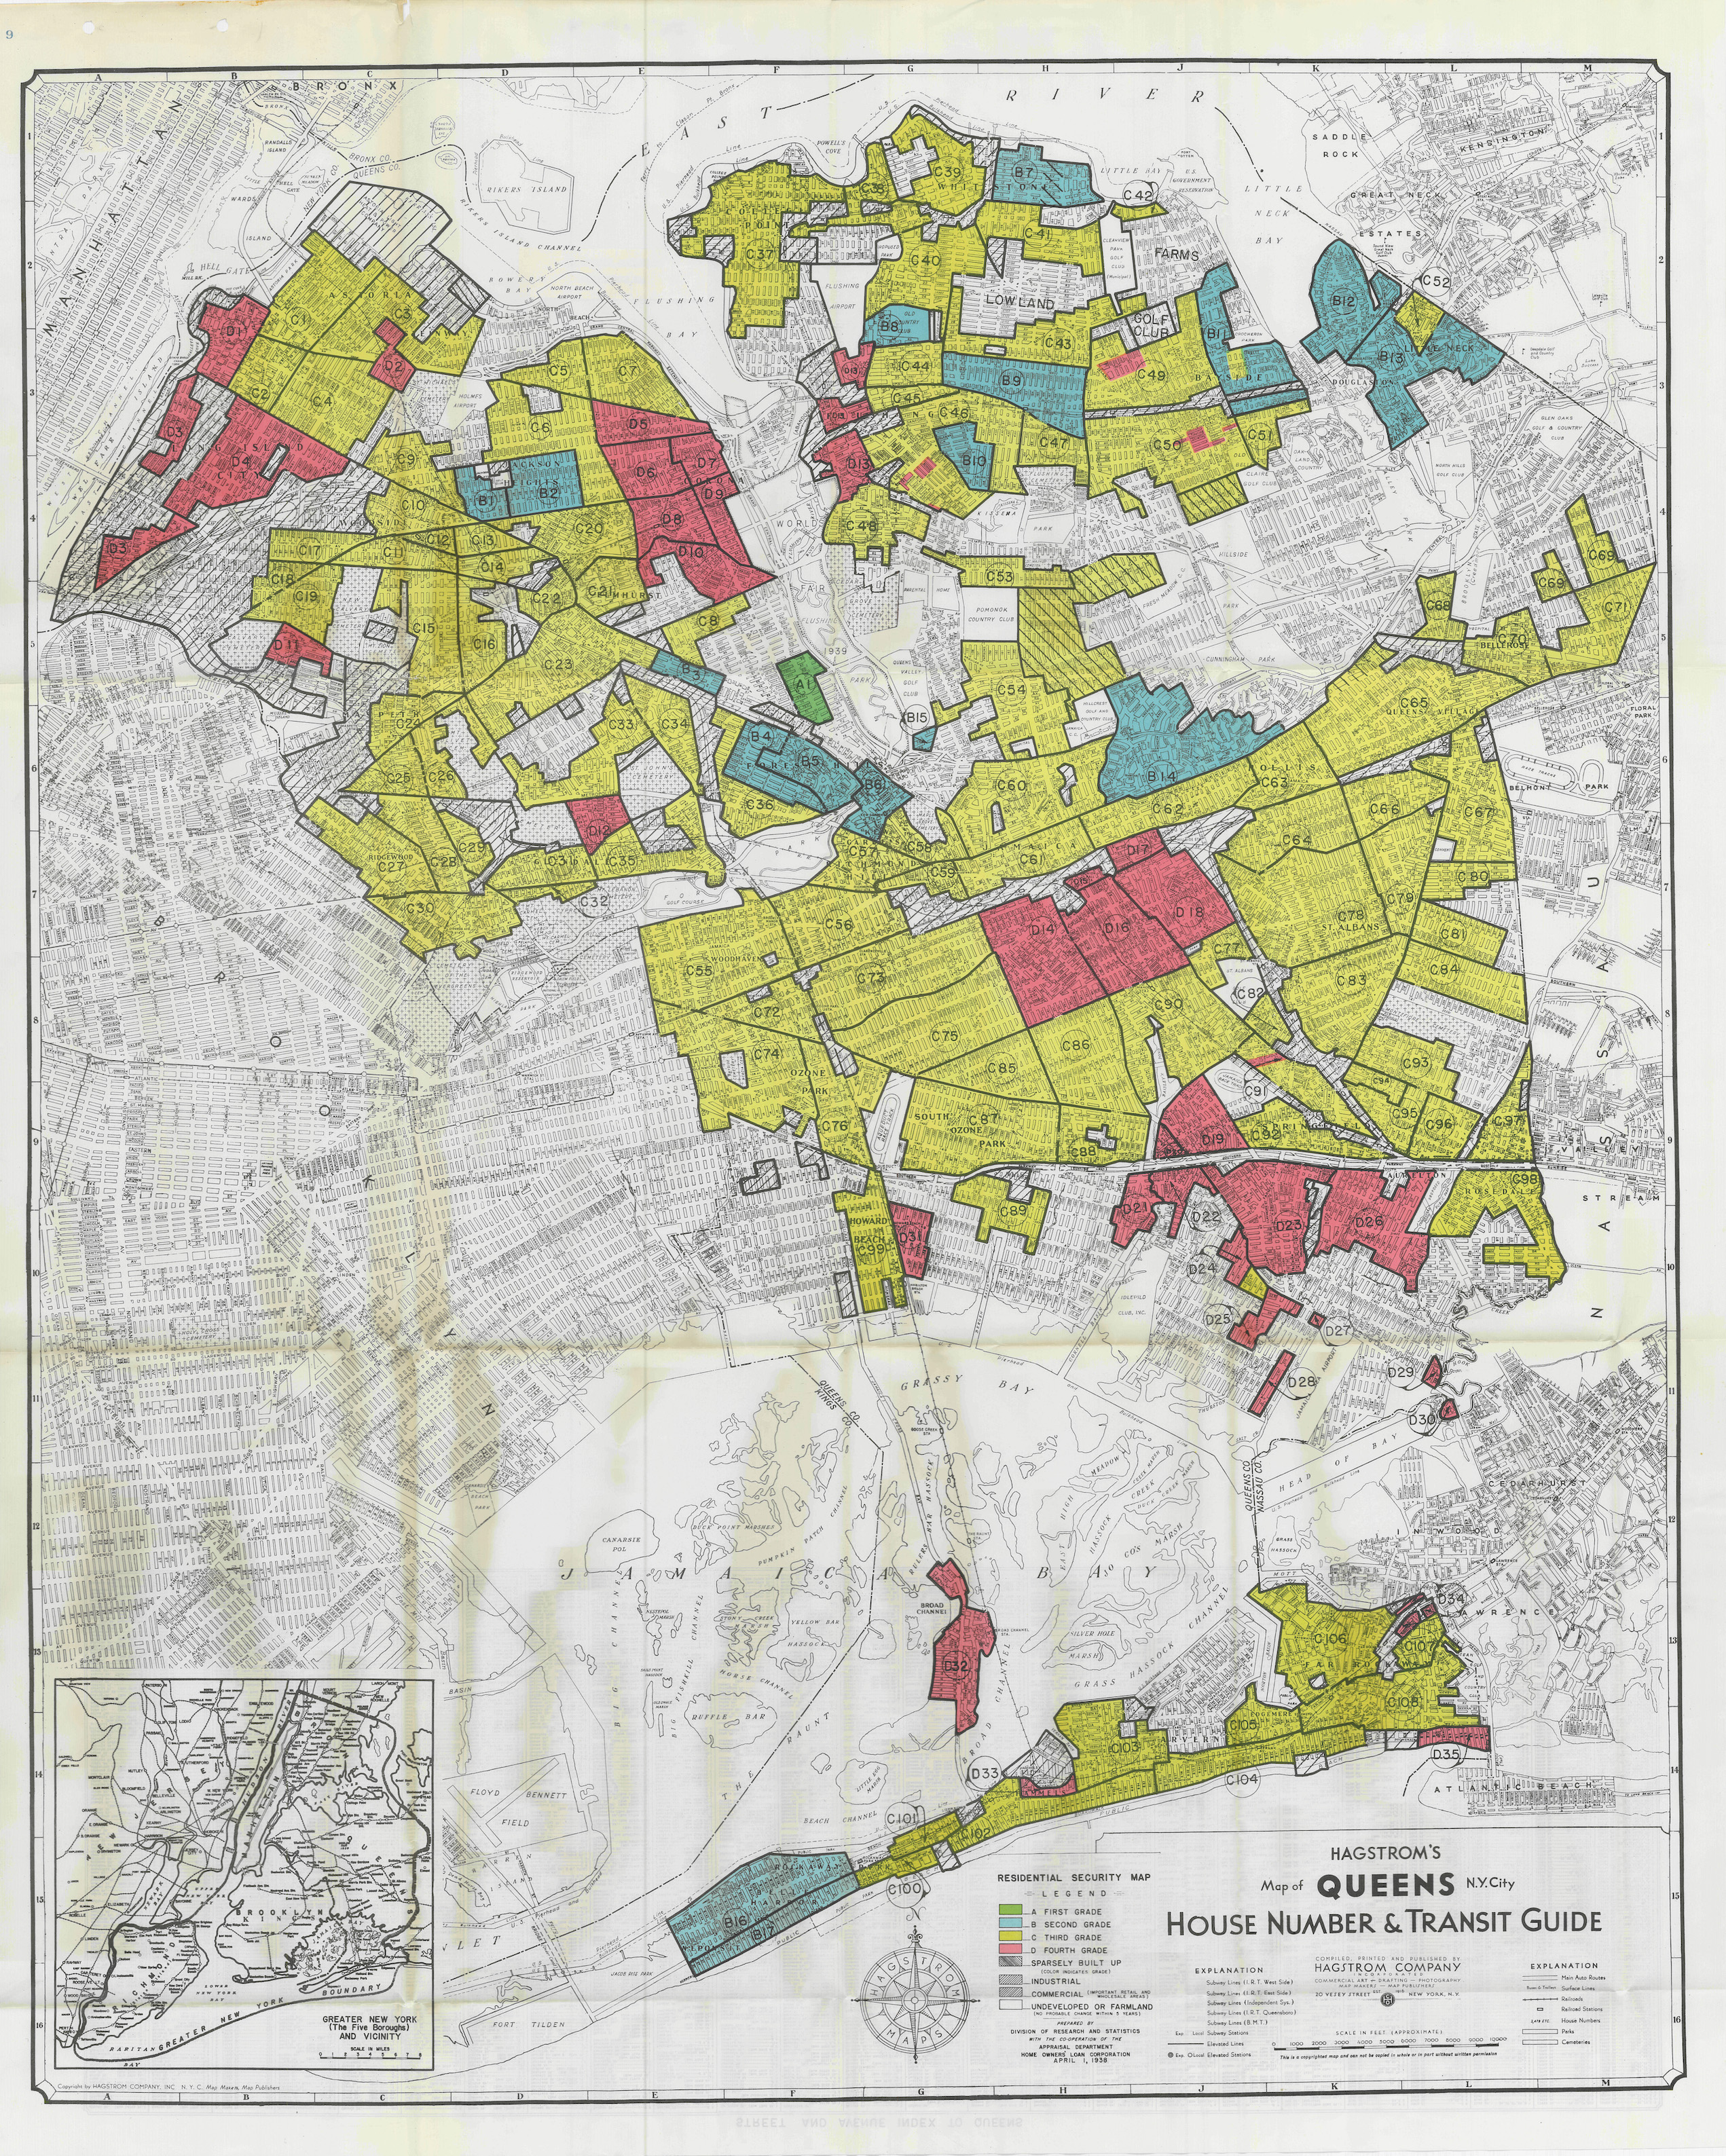
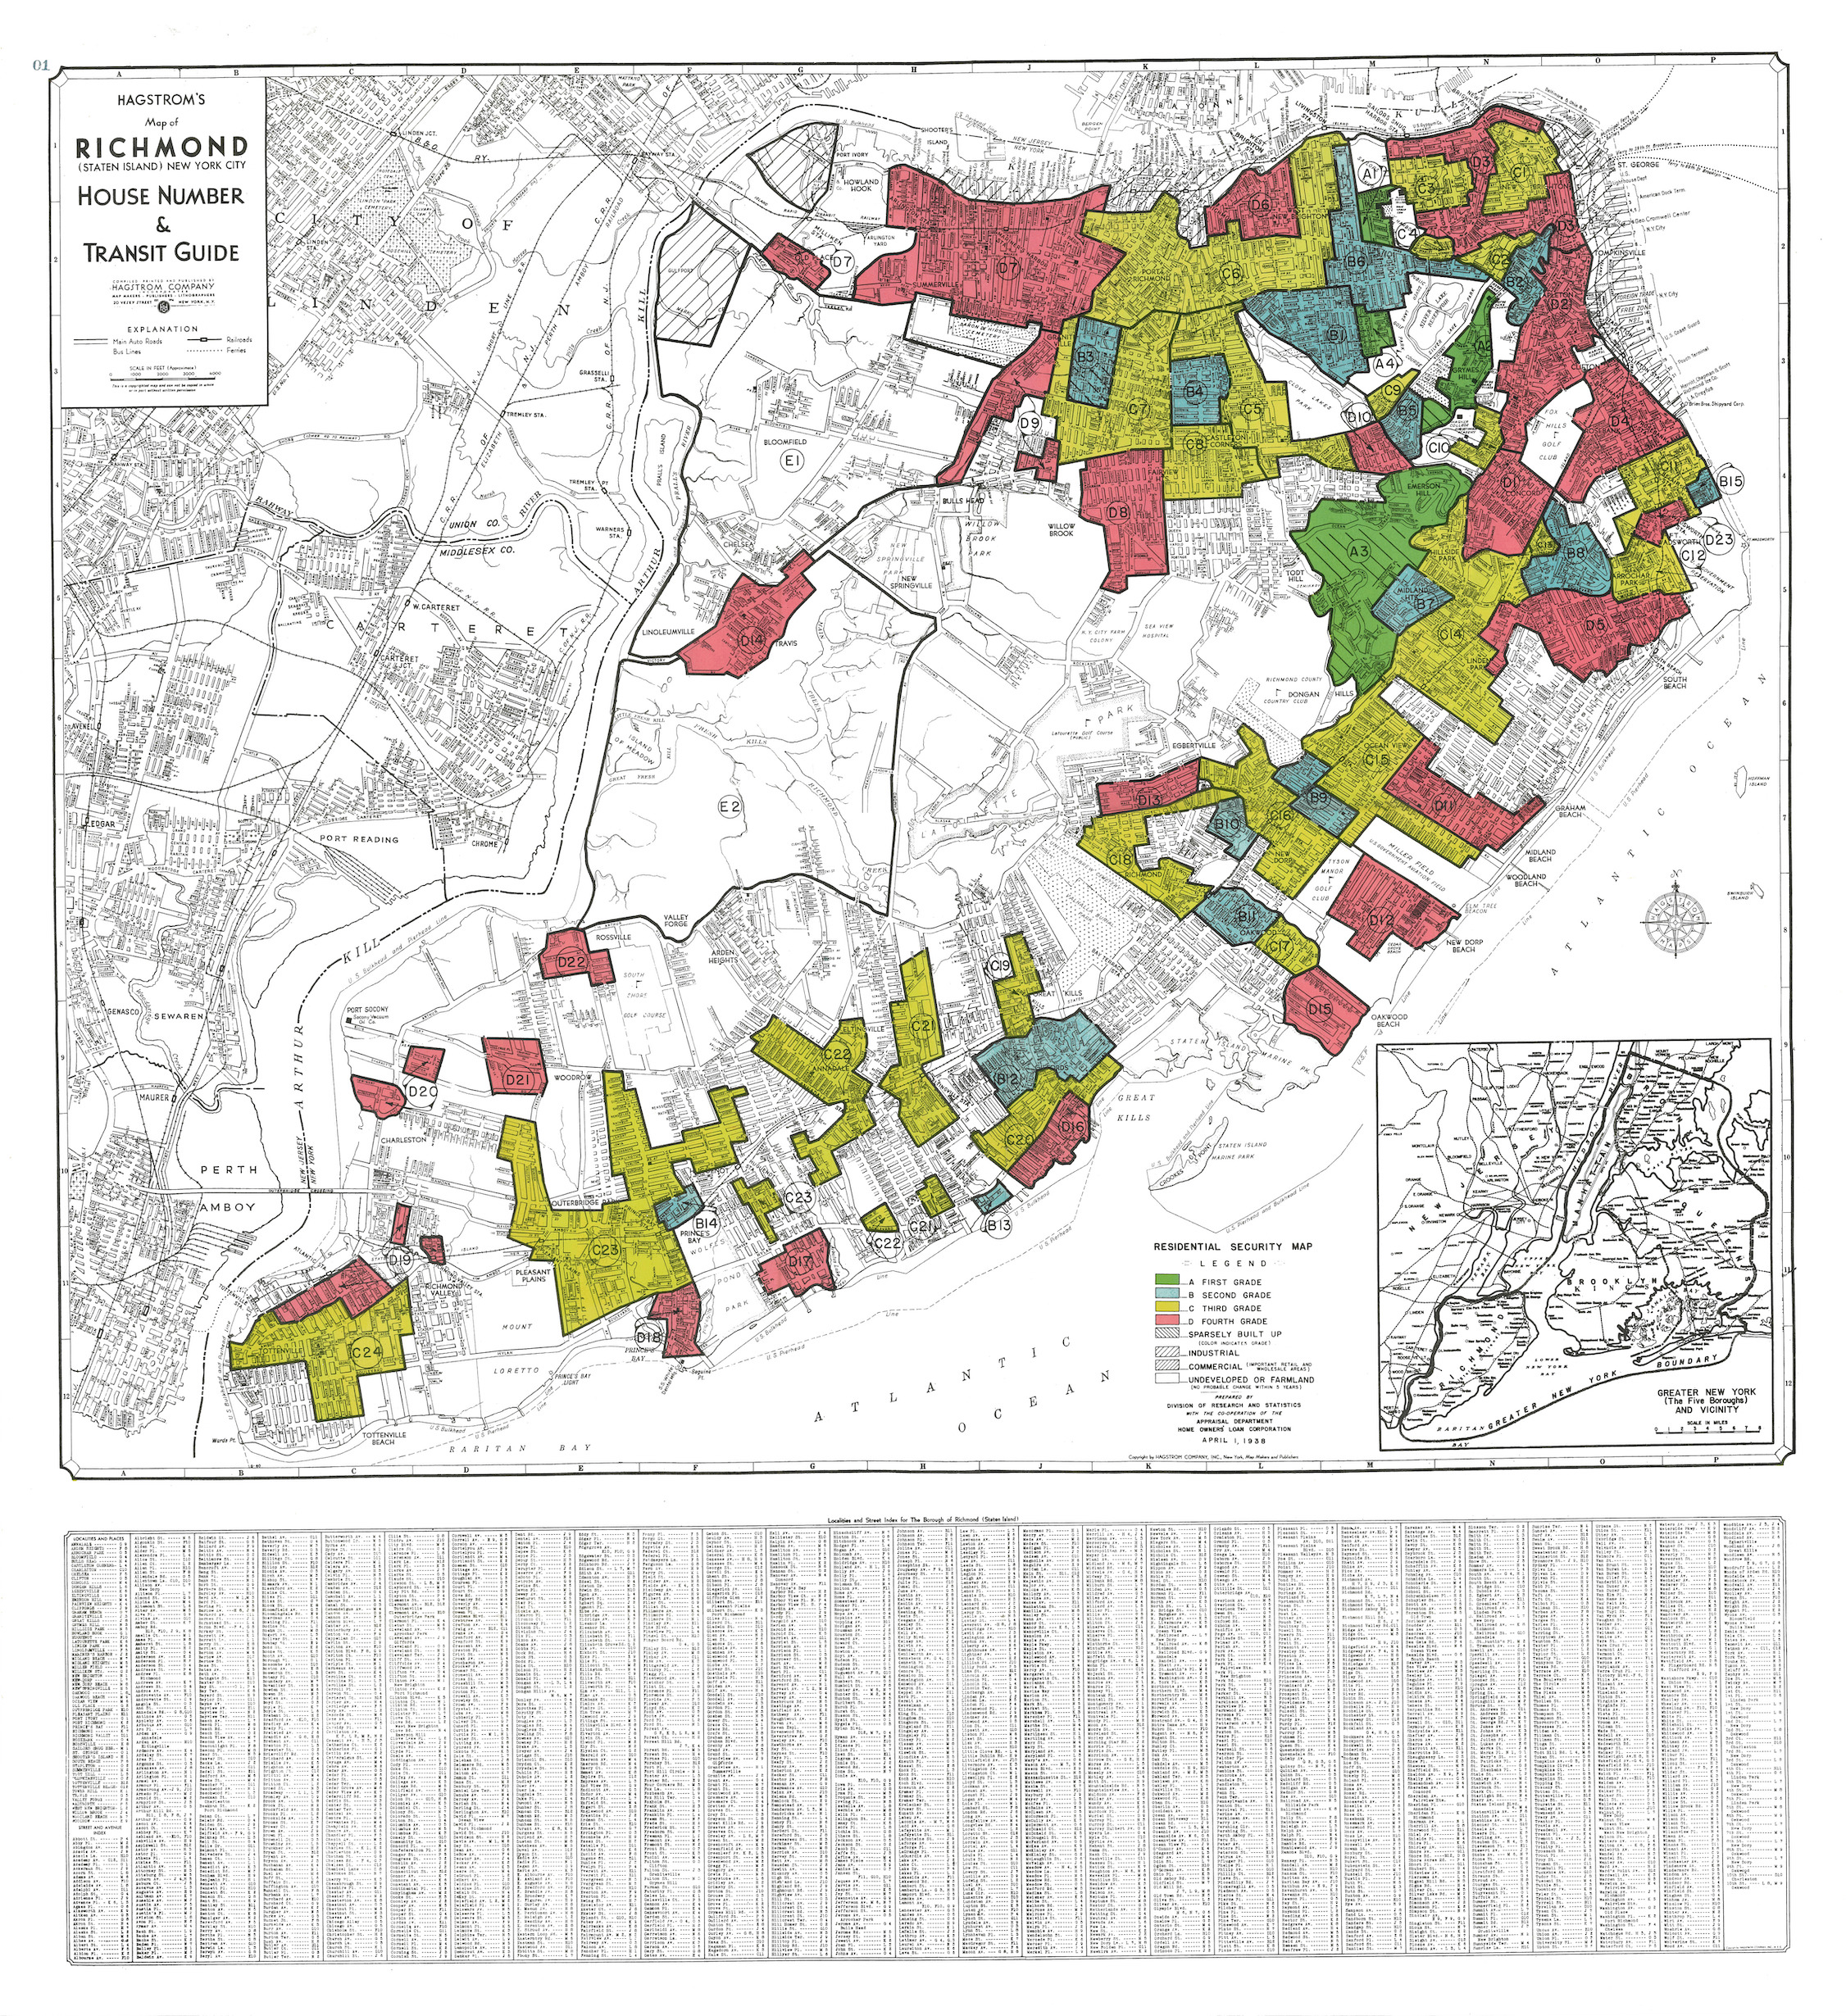
Here are scanned images of the redlining maps for New York City's five boroughs: Bronx, Brooklyn, Manhattan, Queens, and Staten Island.

Here is a digitized redlining map for all of New York City, reflecting the HOLC Grades.

Grade “A” areas were marked green. These were in-demand affluent neighborhoods, with no Black residents.

Grade ”B” areas were marked blue. These were still considered good, but less desirable than Grade A areas.

Grade “C” areas were marked yellow. These neighborhoods were considered declining, and were often bordered by Black neighborhoods.

Grade “D” areas were marked red. These were typically completely populated by Black residents and were described by the HOLC as “undesirable”. These areas were ineligible for FHA backing.

How has the city evolved since then? What is the state of racial, social, and economic inequality today in New York City?

Rents have mostly kept increasing the past decade.

Real estate prices have increased even more.

But for most New Yorkers, their incomes aren't enough to cover a mortgage. Instead, many New Yorkers are forced to rent.

A lot of new housing was constructed over the last decade...

...but not enough new housing is being built for the people who need it most.

Instead, New York City has experienced more gentrification, resulting in evictions and displacement.

In 2017-2019, there were 57,774 residential evictions in New York City.

Tip

Between 2008 and 2018, the share of recently available rental units affordable to households earning 80% of Area Median Income (AMI) dropped significantly, from 50.9 percent to 40.9 percent.

- NYU Furman Center State of the City 2019


Simply adding housing supply does not necessarily drive down overall prices. In many cases, it does the opposite, since developers almost always build for the top of the market, not for the greatest need...

Because luxury real estate is such a reliable and under-taxed investment in New York City, it is exceedingly rare for tall new buildings in gentrifying neighborhoods to rent or sell at rates that are affordable to those who live nearby.

- Stein, Samuel. Capital City (Jacobin) (pp. 105-106). Verso Books.

Many residents that remain in New York City are severely rent-burdened, spending 50% or more of their income on rent.

The burdens of increasing rents have disproportionately impacted minority neighborhoods.

We're socialized to think of education as a means to a better economic future. Do families and children today have access to better educational opportunities than before?

Tip

Achievement and opportunity are intricately connected. Without one, you cannot have the other.

- It’s the opportunity gap, stupid by Prudence Carter, Stanford Center for Opportunity Policy in Education

In New York City, elementary and middle school students are assigned to a zoned school based on their address. So your chances of attending a high-performing school are largely determined by where you live.

For high schools in lower-income neighborhoods, the "college/career rate" is lower. Fewer students go on to attend college, a vocational program, or a public service program within six months of graduation.

Schools with Gifted and Talented programs are hard to find within historically redlined areas. If the programs are near a historically redlined area, they're invariably on its borders.

Staten Island, with a population of almost 500,000 people, has 8 schools with Gifted and Talented programs. The median income is $74,021 and the population is 62.6% White.

The Bronx, with a population of almost 1,500,000 people also has 8 schools with Gifted and Talented programs, despite having 3 times the population of Staten Island. The median income is $35,302 and the population is 9.6% White.

Effectively, we've carried over redlining today into housing, and we've also extended it into education.

When we think about inequality in housing and education, we can't expect progress if we ignore the root causes.

Tip

You've had people support accountability measures for students and teachers, but not necessarily be willing to think about and look at these larger structural factors that are actually impacting what's happening in the classroom.

- Ibram X. Kendi in Achievement Gap, Or Opportunity Gap? What's Stopping Student Success, WBUR On Point

In this final chart, we can truly see how the relationships of inequalities in housing, education, and income interact with each other throughout the different boroughs of New York City. These relationships are interdependent, and still have a big impact on the residents of the city today.

Tip

What Can We Do?

Although the effects of redlining touch so many parts of life, individuals can help by taking action.

A great place to begin is to learn about the complexities of inequalities from historical discrimination, as well as understanding legislative efforts that can address these inequalities.

According to a Boston-based organization, Shelterforce, some policies to support include:

  • Supporting housing for middle-income residents
  • Reducing or freezing property taxes to protect long-time residents from being pushed out
  • Protect senior citizens with low to moderate incomes from having to sell their homes
  • Prohibit large-scale luxury development in at-risk neighborhoods
  • Create housing vouchers for long-term, low-income residents to keep them in their neighborhoods when gentrification poses a risk
  • Change fair housing rules to protect low-income urban communities of color
  • Ensure that new housing is being built to keep up with demand

Besides supporting these types of policies, you can always read more about inequality and the consequences that policies like redlining have had on urban communities of color. You can learn about how to combat gentrification and the root causes of it. You can also donate to community-based organizations that help protect these communities.

Our Team

Card image cap
Britteny Okorom-Achuonye
   
Card image cap
Shavonna Jackson
   
Card image cap
Ray Ortigas
   

References

  1. FXB Center for Health & Human Rights at Harvard University, Study: Structural Racism, Historical Redlining, and Preterm Birth in New York City"
  2. Robert K. Nelson, LaDale Winling, Richard Marciano, Nathan Connolly, et al., “Mapping Inequality”, American Panorama, ed. R K. Nelson and Edward L. Ayers.
  3. StreetEasy, "Download Data".
  4. NYC Open Data, "Borough Boundaries".
  5. NYC Open Data, "NTA Map".
  6. NYC Open Data, "Demographics and profiles at the Neighborhood Tabulation Area (NTA) level".
  7. NYC Open Data, Demographic Profiles of ACS 5 Year Estimates at the Neighborhood Tabulation Area (NTA) level".
  8. NYC Open Data, "Demographic Profiles of ACS 5 Year Estimates at the New York City and Borough Level".
  9. NYC Open Data, "DOB Permit Issuance".
  10. NYC Open Data, "Evictions".
  11. NYC Open Data, "2018-2019 School Demographic Snapshot".
  12. NYC Open Data, "2019 DOE Gifted and Talented Admissions Guide".
  13. NYC Open Data, "2019 DOE Middle School Directory".
  14. NYC Open Data, "2019 DOE High School Directory".